

☆
1
Comments:
Very well written paper proposing an interesting algorithm to solve (lossless and lossy) graph summarization problems (cf problem definition). The algorithm is parallelizable in a shared memory environment and can be distributed using mapreduce. The theoretical analysis is sound and shows that the algorithm has a linear time complexity in practical scenarios. The experimental evaluation shows that the algorithm achieves a better trade-of between time and quality than existing approaches. In particular, the algorithm is faster than the greedy heuristic while leading to similar results. The proposed algorithm can be seen as a scalable implementation of the greedy heuristic: using shingle hashing of nodes allows to prune the search space and consider only some relevant pairs of nodes instead of considering all pairs of nodes (or all pairs of nodes sharing at least one neighbor).
### No theoretical approximation guarantees:
The graph summarization problem is well defined and has an optimal solution. The proposed algorithm does not seem to have any theoretical approximation guarantees. According to the experimental evaluation, the quality of the output is similar to the one of the (straightforward) greedy heuristic, but we do not know how far from optimality it is.
Is there any algorithm for the problem with some theoretical approximation guarantees?
### Absolute performance:
While the performance relatively to other algorithms is good, the absolute performance of the algorithm is somehow disappointing. Figure 3: we see that the size of the output graphs is larger than 40% the size of the input graphs (in terms of (super) edges) for all graphs (and in many cases larger than 70%) except for the two web graphs (it is known that web graphs can be compressed efficiently (cf the webgraph framework)) and surprisingly a protein interaction graph (only 10% of edges are kept).
☆
0
Comments:
Question asked: how can you audit a recommender system if you don't have access to user-item interactions?
Answer proposed: use a "recommendation graph" and simulate user behavior with a random walk with teleportation.
Legitimate question, I am not completely convinced by the answer but it has some merits, in particular, simplicity.
### Introduction
- to measure : diversity / segregation-polarization (not accuracy)
- use the structure of an underlying network
- 3 datasets, all movies RS : IMDB, Google Play, Netflix ; films have a genre in a list
##### Contributions : quantifying diversity
- use a notion of graph: directed link from i to j if j is recommended on i page
- measures based on films genre ; popularity based on the graph structure: in-degree, PageRank
- segregation quantified with concentration and evenness (8: Chakraborti et al, 2017)
### Related work
##### diversity in RS
- 9 : Nguyen et al, WWW 2014: CF impact on user behaviors
- 10: Zhou et al, PNAS 2010 (Auralist) defines novelty
- 11: Santini and Castells defines diversity et novelty with a fuzzy interpretation
- 12: Vargas et Castells, RecSys 2011: novelty and diversity from a user perspective
- 13: Lathia et al, SIGIR 2010: considers temporal aspects
##### on polarization dynamics
- 20: DeGroot explanation from opinion modeling
- 17: Dandekar et al, PNAS 2013 : polarizing effects of RS algorithms
- two main schools of thought to explain polarization: either opinion is reinforced by interactions with like-minded people or people are exposed to opposite views then reject them (hence polarization
### Framework for auditing RS
##### Network construction : see above
- possible to give weights to the links in tne network depending on item-item similarities, or based on the rank of j reco on i page
- but overall different with literature: directed network and not based on similarity
##### User modeling : see above (RW with teleport), as we don't have access to navigation logs
- then we consider distribution of types visited during the RW
##### Datasets : see above
- general stats : see tab1
- collect by snowball sampling (from one node, then neighbors, then neighbors of neighbors... like a BFS)
- to account for personalization effects, crawling from a unique IP adress
- film genres: 15 for GP, 29 for Netflix and IMDB
- compare distributions for 400 steps RW with no teleport (so, sort of random sampling): GP dominated by Action, IMDB more balanced
### Diversity in RS
##### existing measures
- similarity between items computed with Jaccard coefficient
=> possible to compute usual measures (ILS (15), long-tail novelty (14), unexpectedness (23), source-list diversity(16))
- Table 2 : traditional measures on the datasets
- observation : Netflix has greater source-list diversity, but IMDB more diverse according to other measures
##### new measures
- assortativity by genre, by popularity (using as a proxy normalized centralities: in-degree, pagerank) => see Table III
- contingency matrices: fraction of links from genre to genre (fig2); in general RS recommend from a genre to the same one + some specific relation between specific genres
- equivalent for popularity: bins of popularity (bottom/middle/top) then count links from a bin to another (fig3); in general push toward long-tail, especially on IMDB
##### New measures based on RW
- entropy of the genre distribution obtained
- exploration when parameters vary (N = RW length, tp = teleportation probability, starting point)
- fig4a : evol with t_p (small increase then plateau)
- fig4b : évol with N (growth)
- note that the RW is finite and we do not reach the steady state
##### Information segregation in RS
* use measures in Chakraborty et al.(8) : evenness and concentration
* evenness : to what extent a group is exposed uniformly to info units , it (1-Gini) with Gini computed on the genres consumed by the users of the group (1 ~ even consumption)
* concentration : 1/2 . sum (fraction of films i consumed by the group).(fraction of the films consumed by the groups).(fraction of the films of genre i) ; if concentration is low what is consumed is close to what is proposed
* results on fig5
☆
0
Comments:
Nice article : easy to read, recommendation method is quite straightforward and efficient considering the task, impressive dataset.
## Summary :
### Introduction
* two aspects underexplored in the field of news consumption : increase of shortcuts to news portals, browsing behavior in news consumption
* focus on the influence of the referrer on the user behavior (to predict where they go)
* data 500 millions viewlogs of Yahoo News
* compare 24 types of recommendation (actually 24 flavors as the principle is quite similar from a method to another)
* contributions: browse graph definition, study the browse graph on their dataset, provide recommendation method for next article to read
### Related work
* problem of cold start recommendation, one possible way to circumvent is to use a small set of preferences ("warm start")
=> how to use the little amount of information available (like the social network)
* here, info = referrer URL and current reading
* literature for news recommendation : use predominantly user history ; here sort of collaborative filtering
* browse graph and referrer URL : ref analyzing browsing sessions ; browse graph already used in literature
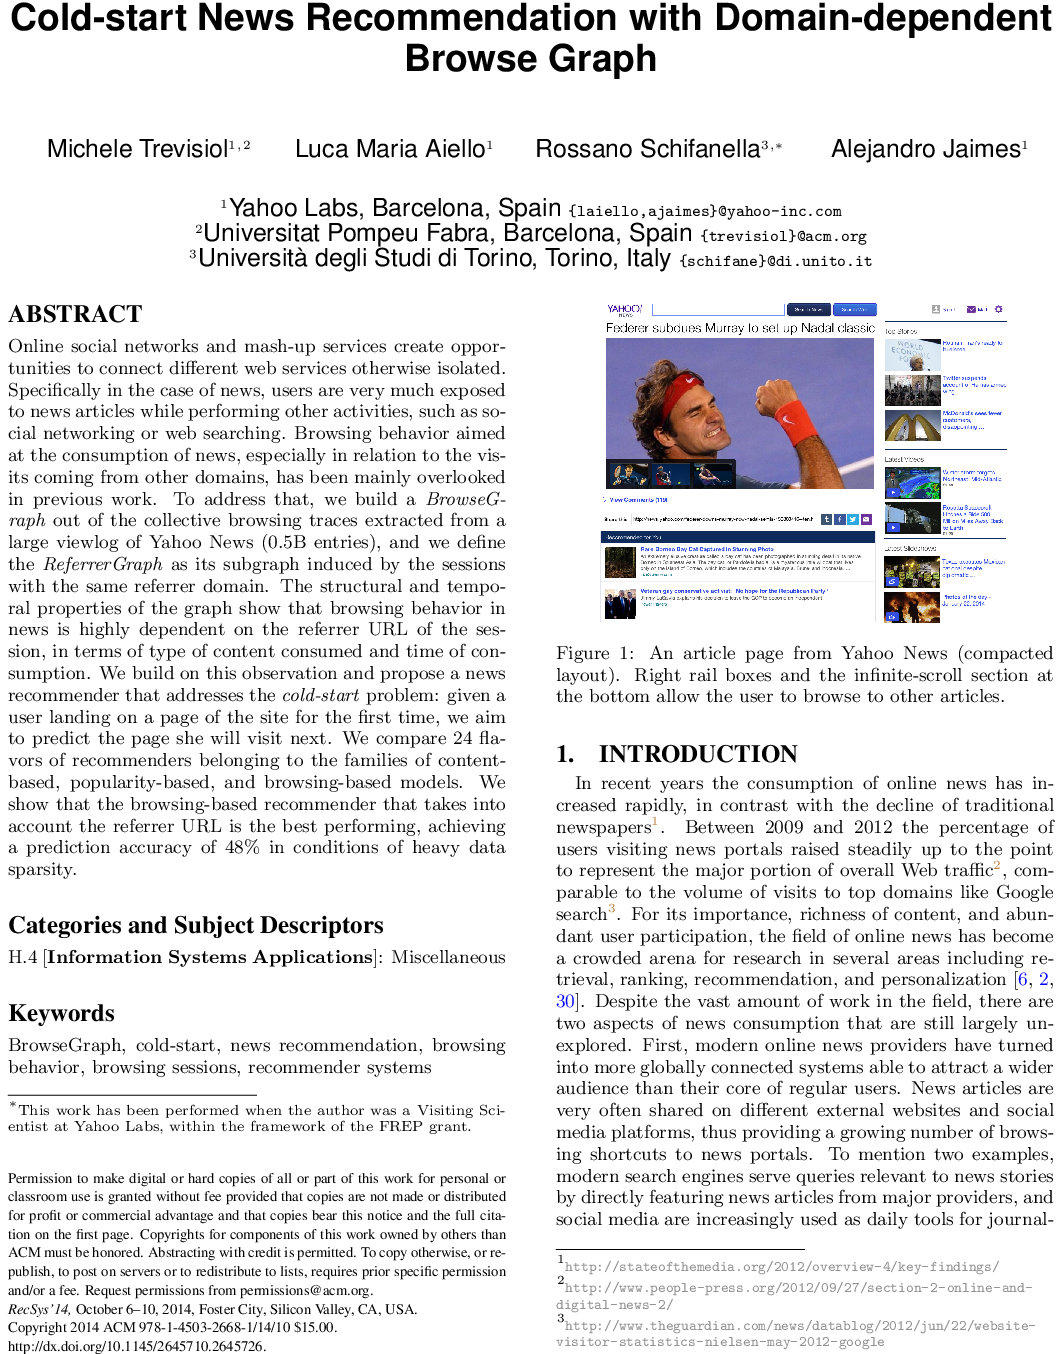
### Browse graph in the news domain
##### dataset :
- Yahoo pages have infinite recommendation when scrolling
- cookie contains : current URL, referrer URL, temporal information, brwoser information
- split in sessions with timeout 25 minutes
- 22 article topics (editorially assigned) - see tab3 for examples
##### about the browsegraph :
- definition : aggregated graph of transitions, with weights
- paper focus : contents differences depending of the origin
- process : breaking down the browsegraph depending of the referrer (Twitter, Facebook, search engine, etc)
- hourly separation
### Analysis
##### description referrer graphs :
- browsing sessions are short but typical distance in GWCC of the browse graph is 5 (cf tab2)
- all referrer graphs have a GWCC which contains more than around 90% of nodes
- degree distributions vary a lot from one to another, weight distributions don't (fig2)
- testing if RG vary from one to the other in terms of nodes => measure overlap with Jaccard index and Kendall-tau between pageranks (fig3)
=> two major groups : search vs social
- most popular topics per RG : see tab3
##### evolution through time :
- fig4 : cumulative number of views => 80% visits during first 30hrs and first 20% of lifespan (consistent with literature)
- does it vary with RG considered ?
- fig5 : 3 categories homepage / search / social
=> rapid decay in three cases, social exhibits consumption spikes later in their life span
- fig6 : topic influence
=> most cases homepage > search > social ; standard dynamic (sports, movies, blogs) : search starts close to social and then gets closer to homepage
- fig7 : change through time, Kendall tau (rank at time t=0 vs rank at time t)
=> decrease then steady after roughly 24h (questionable observation from my pov), lesser offset for search than for the rest
### Cold-start prediction of next view
##### problem definition :
- predicting page seen after starting page
- restriction to users who have at least one page view after starting page
##### selection of candidate pages :
- full : all (out)neighbors in the Browse graph
- ref : or all neighbors in the Referrer graph only
- or mixed : if no proposition in the RG then full BG
##### topical filtering :
- case of Twitter and Facebook : possible additional constraint to search into the same category
##### prediction method :
- random (baseline)
- cb : most similar in content, using text-based metrics
- pop: highest view count at previous timestep
- edge: maximum weight link from the same node at the previous timestep
##### results (Fig8) :
- quality measures : precision and mean reciprocal ranking@3
- trend : random < pop ~< cb < edge => (overall conclusion) weights of the BG effective to anticipate user needs
- trend : full < ref < mixed
- precision increases with smaller domains, just because the set of possibilities is smaller
- trend : using topical filtering => drop in precision (because high probability of topic transition)
☆
1
Comments:
[Rob Pike](http://www.herpolhode.com/rob/) complains about software systems research.
A decade later he designed the [go](https://en.wikipedia.org/wiki/Go_(game) language together with Robert Griesemer and Ken Thompson.
Comments: